Students
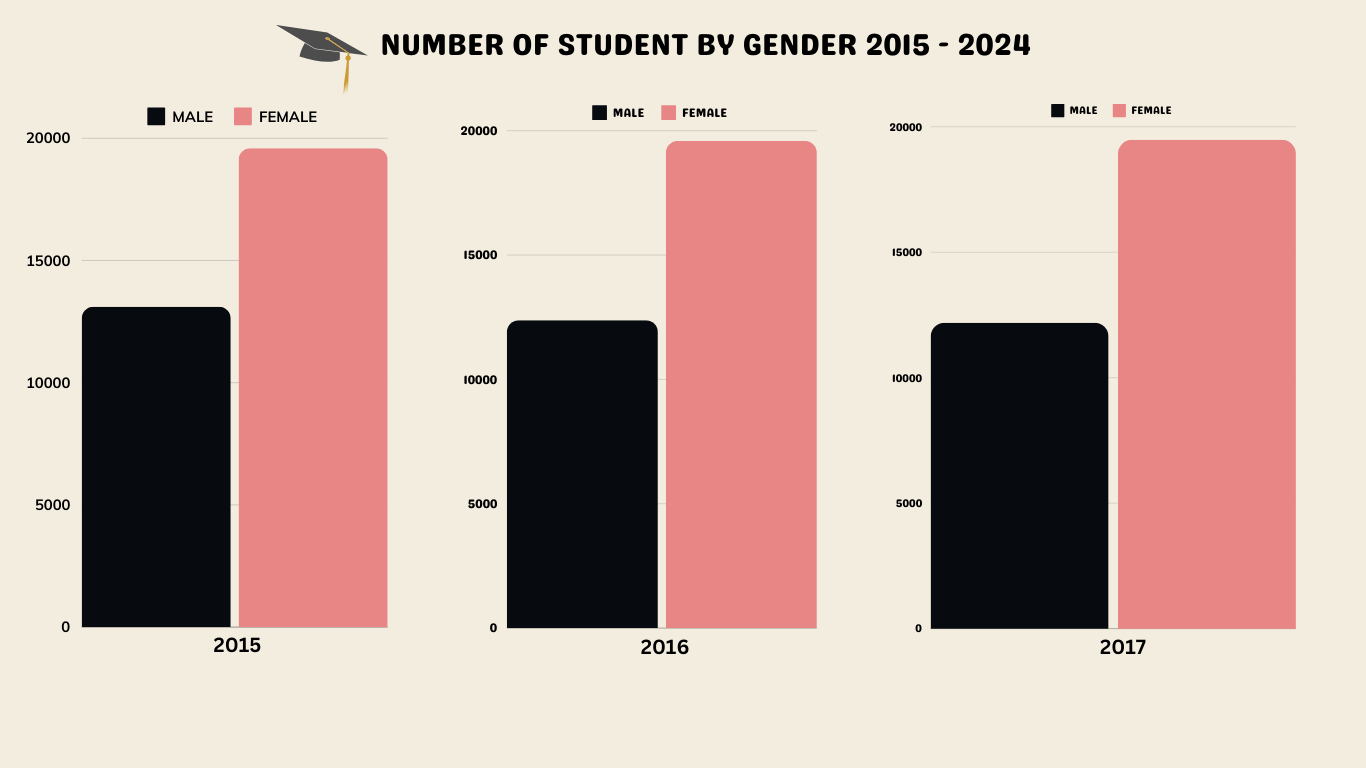
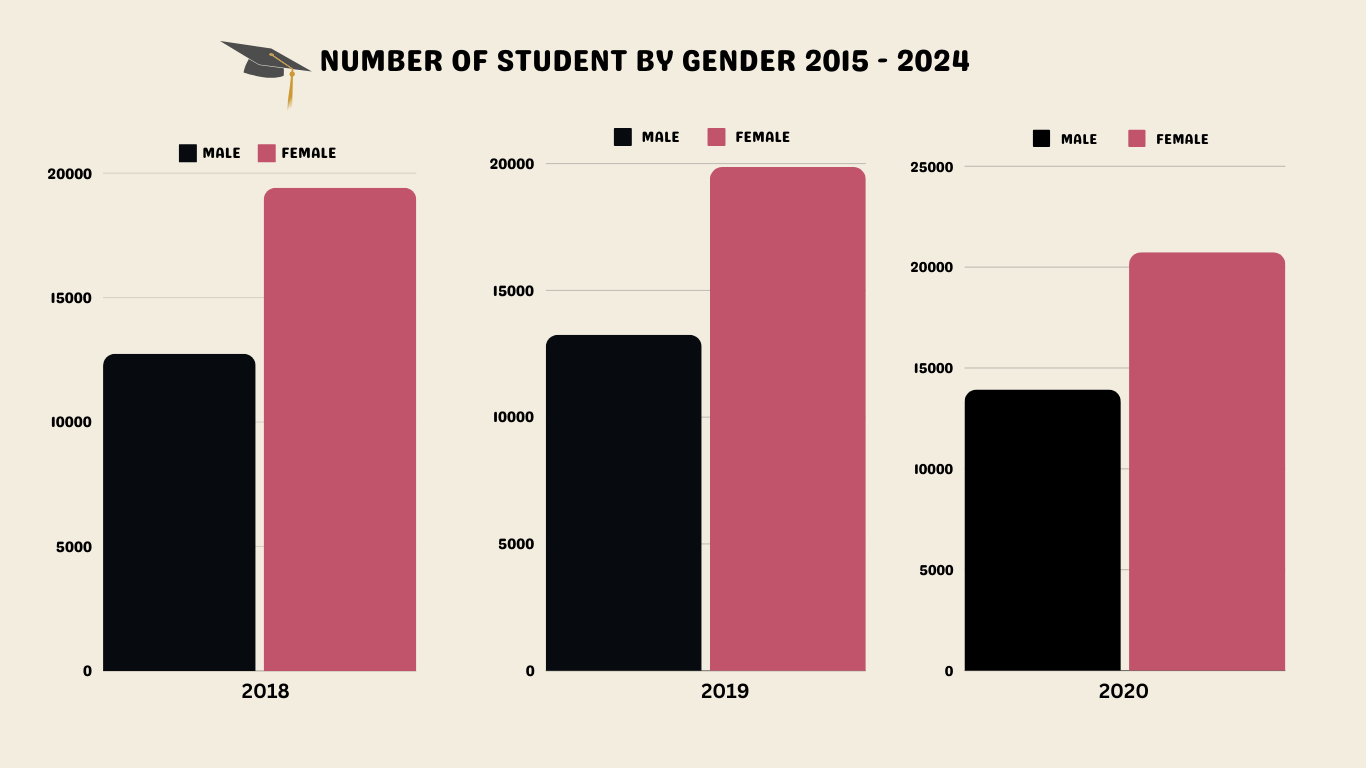
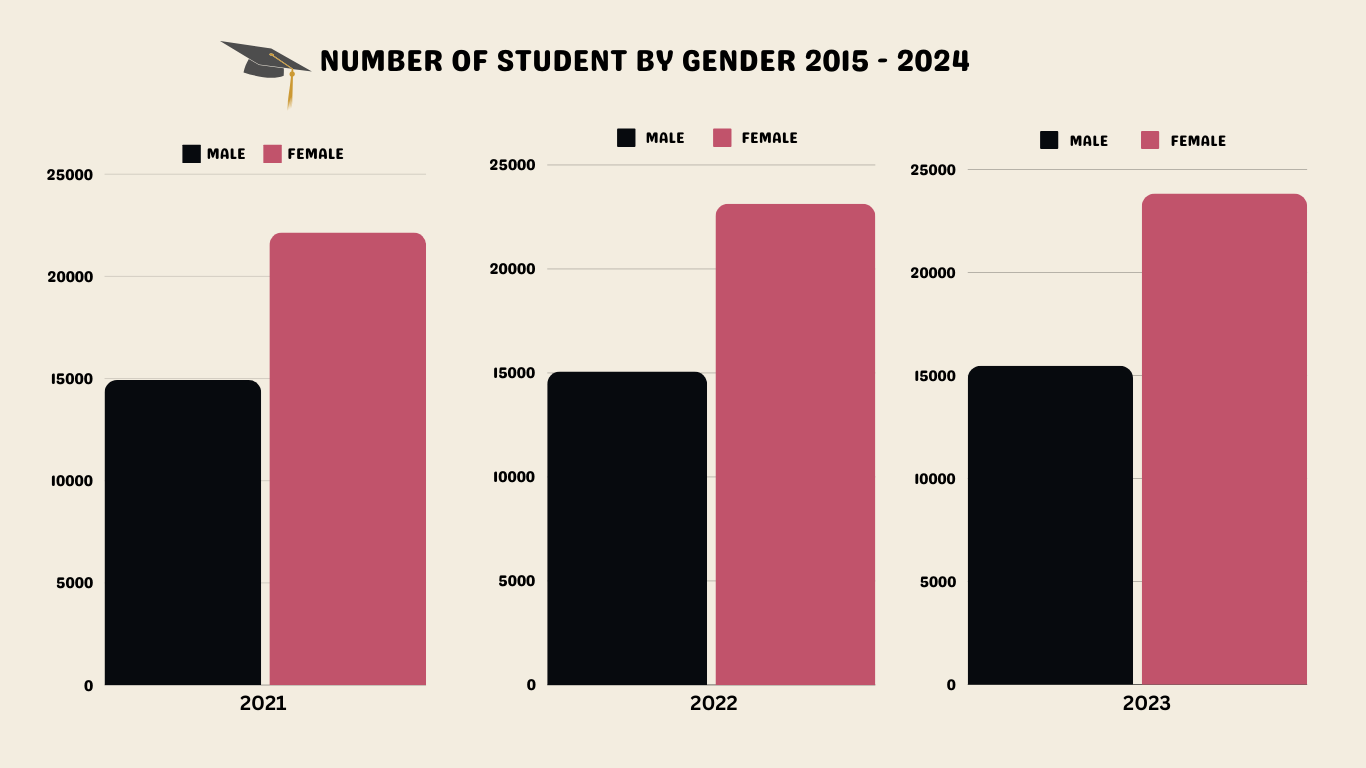
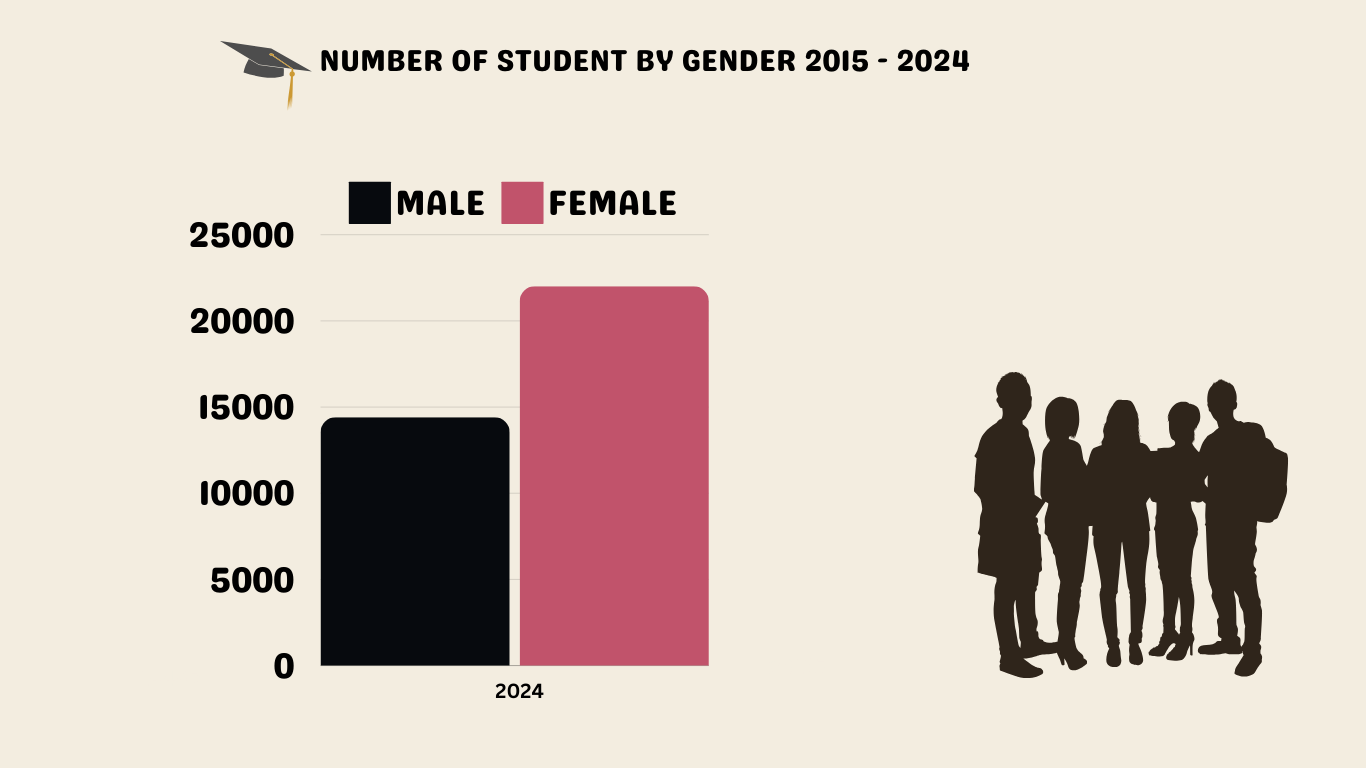
a. Number of students by gender
A consistent trend can be observed where the number of female students is higher than that of male students throughout the period. The number of male students generally increased from 2015 to 2023, with a slight decline in 2024. On the other hand, the number of female students shows a steady rise from 2015 to 2023, followed by a noticeable drop in 2024. The percentage of female students consistently exceeds that of male students throughout the years 2015 to 2024. The proportion of female students ranges between approximately 59.7% to 61.5%, indicating a dominant representation in the student population compared to males every year. This trend highlights a sustained higher enrolment of female students across the given period, even though there was a slight decrease in overall student numbers in 2024. Overall, the total student population increased each year until 2023, with a small decrease in 2024. This indicates that while there was a general growth trend in student enrolment, both male and female student numbers slightly decreased in the most recent year
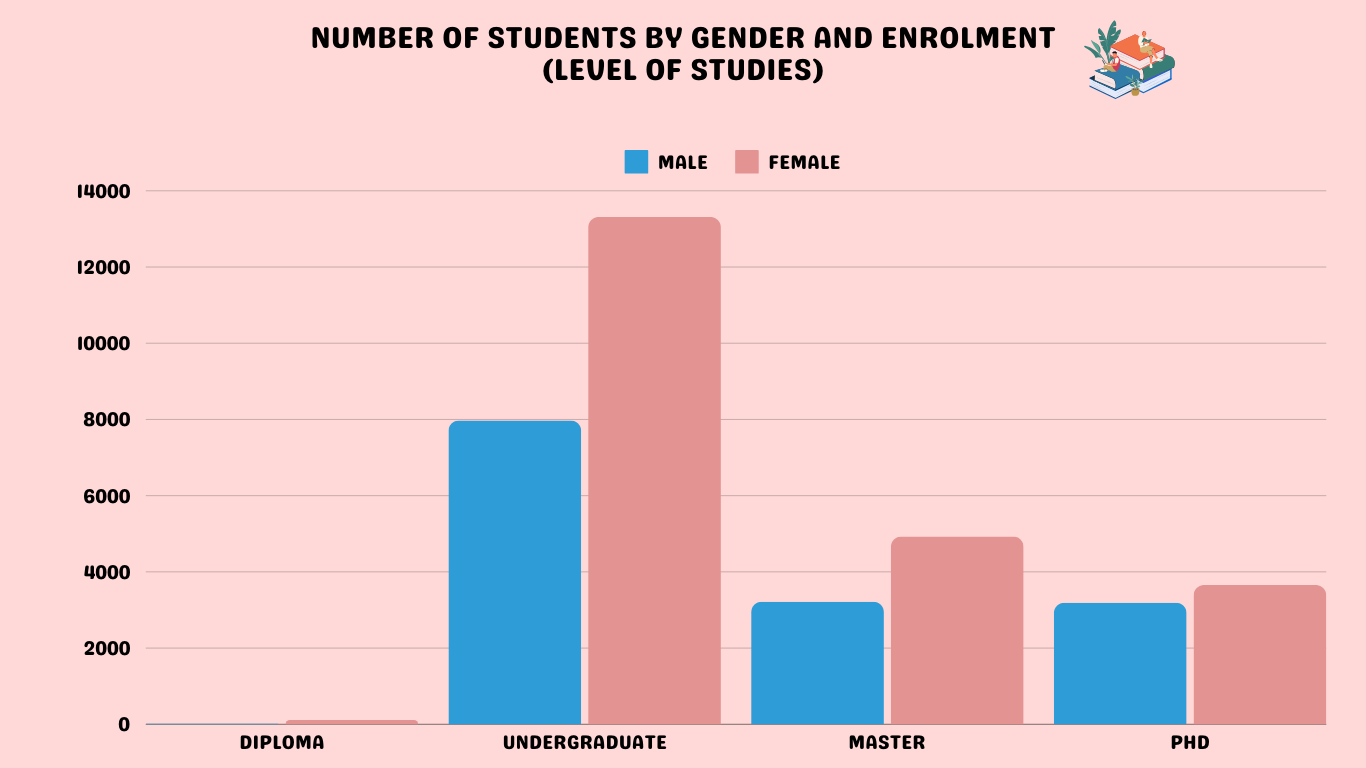
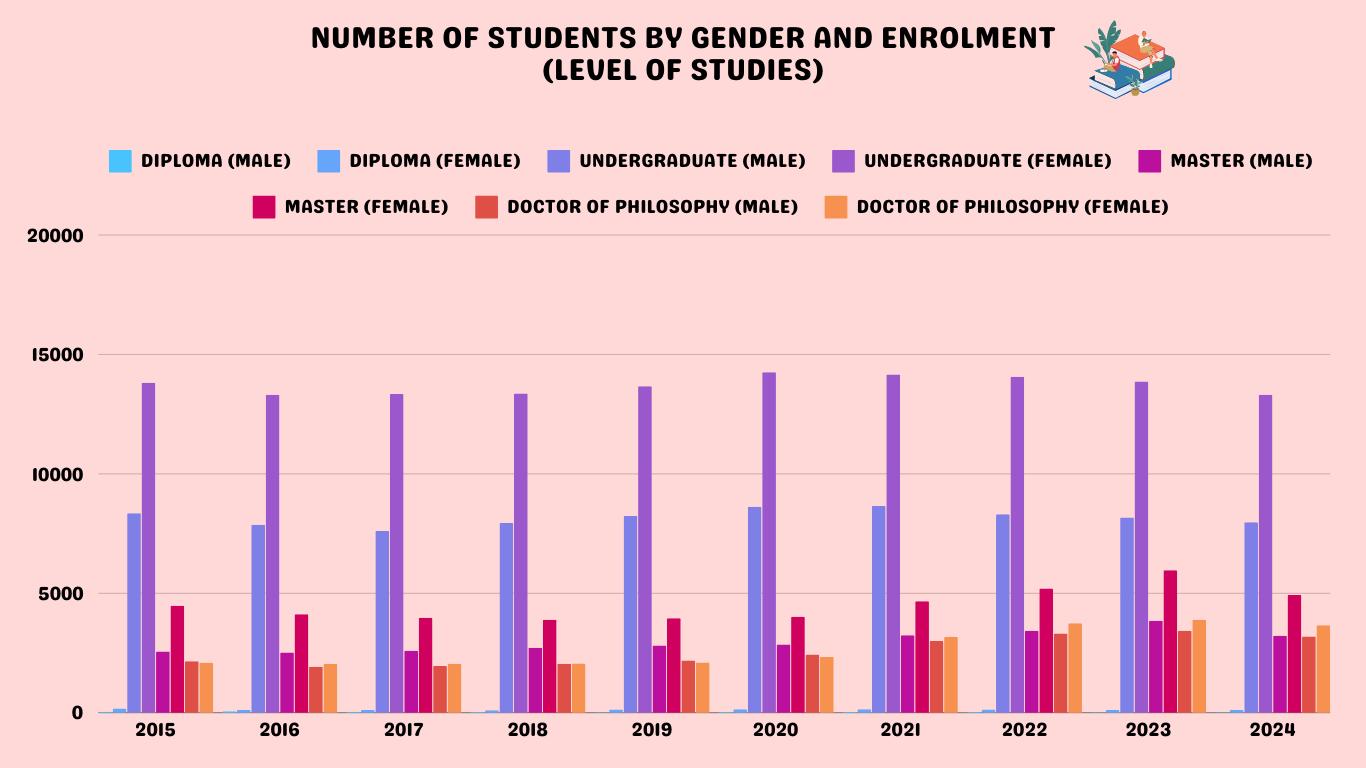
b. Number of students by gender & enrolment (level of studies)
The data analysis reveals a consistent trend of higher female student enrolment across all academic levels from 2015 to 2024. Here are the key observations by academic level:
- Diploma Level: Female students represent a significant majority, with their percentage ranging from around 65.3% to 86.1%. This consistently high proportion demonstrates a clear dominance of female enrolment in Diploma programs.
- Undergraduate Level: Female students maintain a steady lead, constituting about 62.1% to 63.7% of the total undergraduate population each year. This indicates a strong and stable presence of female students at this academic level.
- Master's Level: Female representation at the master’s level ranges from approximately 58.4% to 63.6%. Although the percentages fluctuate slightly, female students consistently make up the majority in this category.
- Doctor of Philosophy (PhD) Level: Female enrolment in PhD programs shows a gradual increase, ranging from 49.1% to 53.4%. This trend suggests a positive movement toward gender balance at the highest level of academic pursuit, with female students now making up over half of the PhD population in recent years.
Overall, female students dominate the enrolment figures at every academic level, highlighting their strong engagement and commitment to higher education across various programs. This pattern suggests that female participation in education has reached a significant level of maturity, reflecting societal progress toward gender equality in academic achievements.
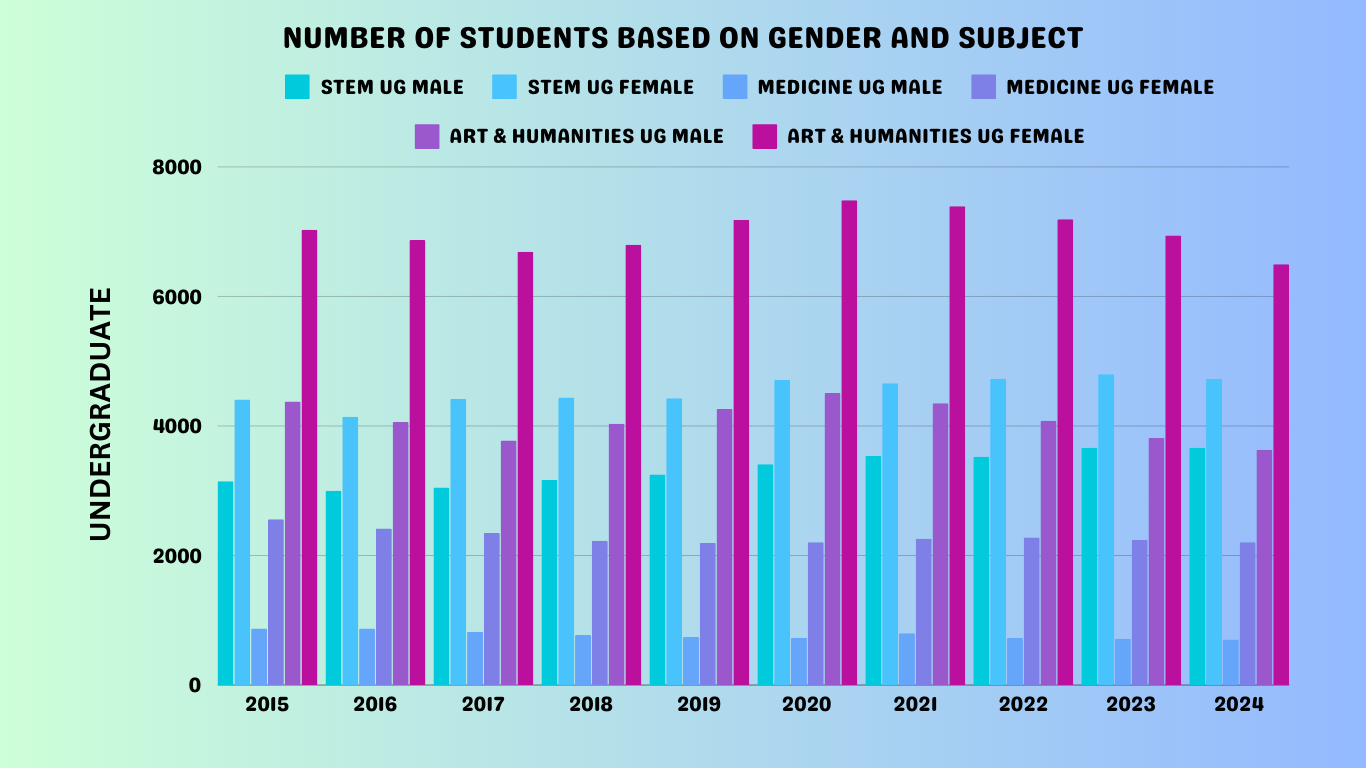
c. Number of students by gender & subject – Undergraduate
At the undergraduate level, female students show a strong presence across all subject fields:
STEM: Female students consistently make up more than 56% of the undergraduate STEM population, peaking at about 59.2% in 2017. This indicates a relatively stable but slightly declining trend in the representation of women in STEM fields.
Medicine: The proportion of female students in undergraduate Medicine programs is significantly higher, ranging from about 73.4% to 75.8%. This trend suggests a strong dominance of female students in this field over the years.
Art & Humanities: Female students account for a substantial portion, with percentages ranging from approximately 61.6% to 64.5%. The percentage of women in Art & Humanities steadily increased, reaching its highest in recent years
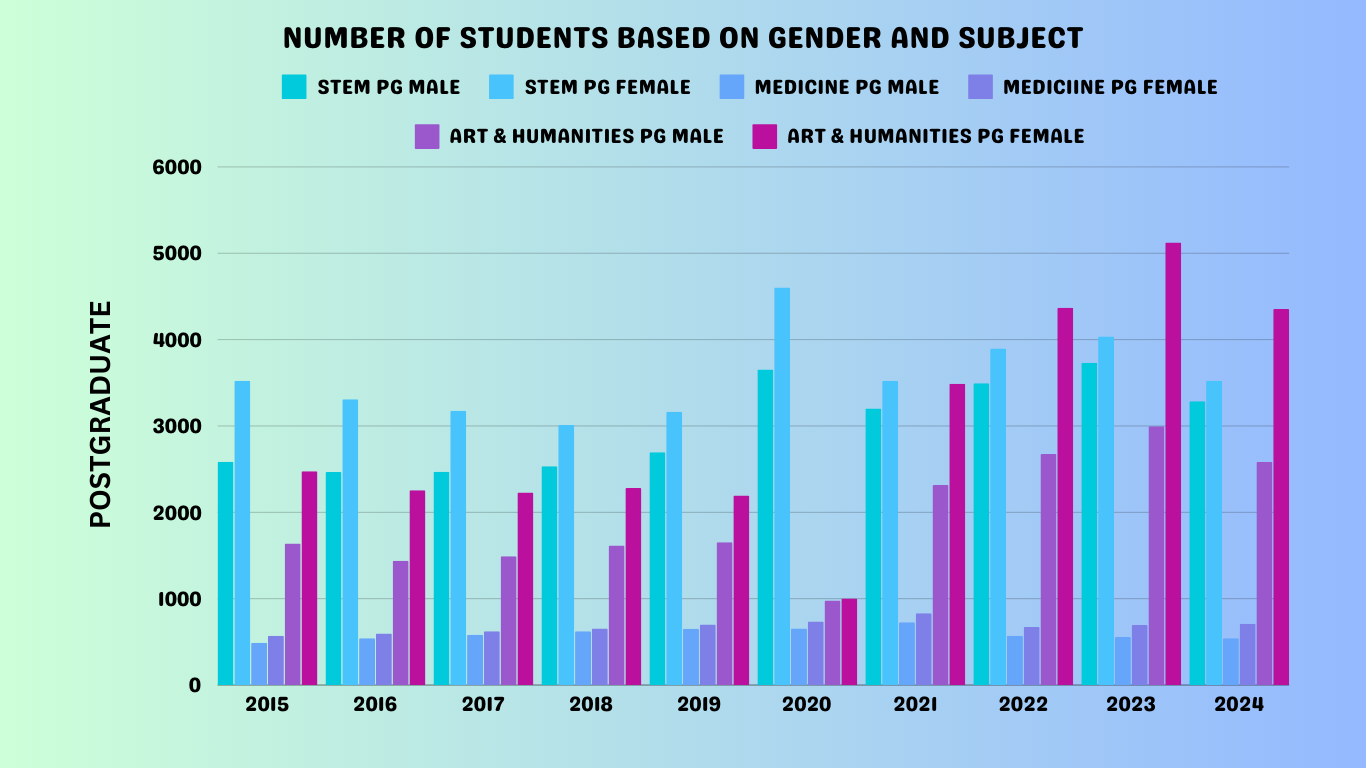
d. Number of students by gender & subject – Postgraduate
At the postgraduate level, the trend for female representation across subject fields is as follows:
STEM: Female students constitute between 51.7% and 57.7% of the postgraduate STEM population. Although they maintain a majority, there is a slight decrease in female representation over the years.
Medicine: Female students in postgraduate Medicine programs show a consistent increase in their representation, ranging from 51.2% to 56.6%. This upward trend highlights the growing presence of women in advanced medical studies.
Art & Humanities: Female representation in postgraduate Art & Humanities is strong, with percentages ranging from about 50.6% to 63.1%. The trend fluctuates slightly but generally shows a positive movement towards more balanced gender representation at this level.
E. Number and percentage of graduated postgraduate students
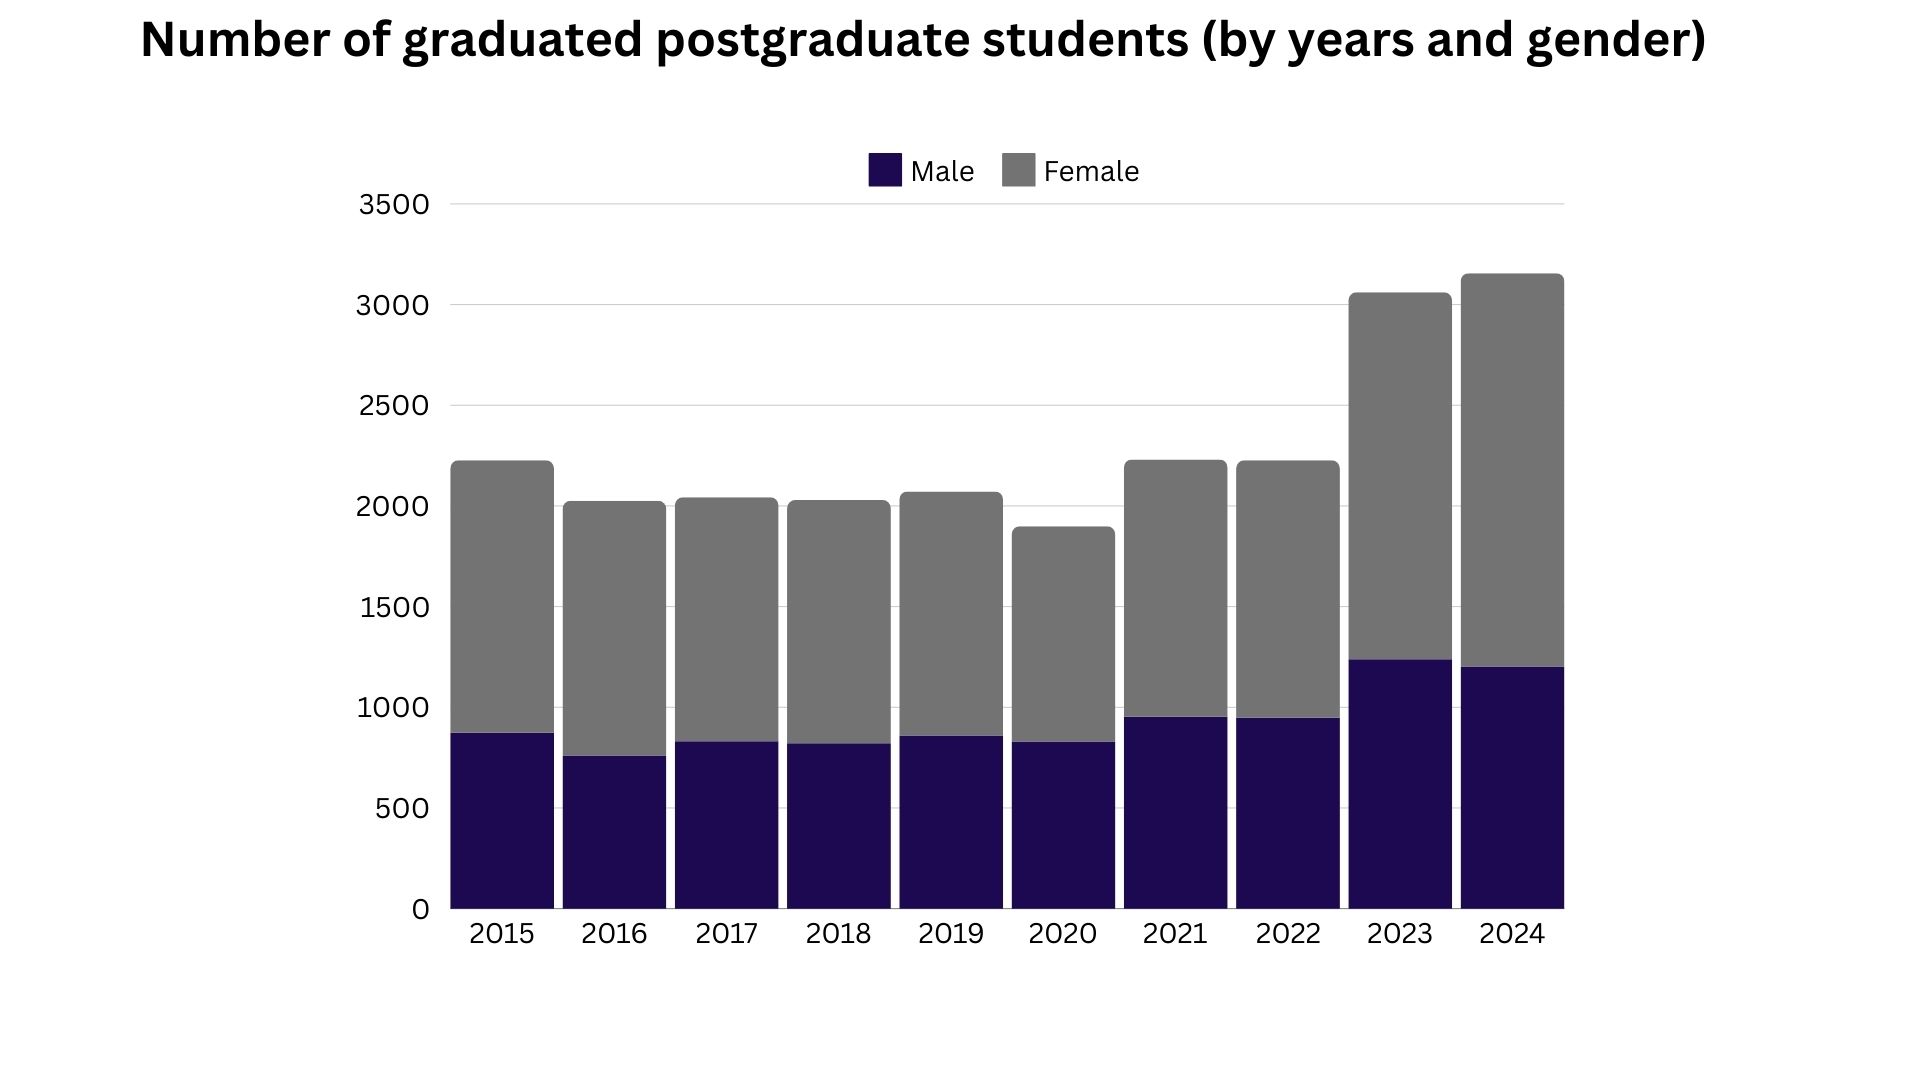
From 2015 to 2024, female postgraduate students have consistently outnumbered male students in terms of graduation rates. This consistent trend highlights the increasing participation and success of women in higher education, particularly at the postgraduate level.
In 2015, the number of female graduates was 1,353, significantly higher than the 874 male graduates. Over the years, while the number of male graduates fluctuated, the number of female graduates remained notably higher each year. For instance, in 2017, the difference narrowed slightly, with 1,212 female graduates compared to 831 males, but still, females maintained a leading position.
By 2024, the number of female postgraduates reached its peak at 1,954, which is substantially higher than the 1,202 male graduates for the same year. This growing trend reflects an increasing focus on female empowerment and education at advanced levels.
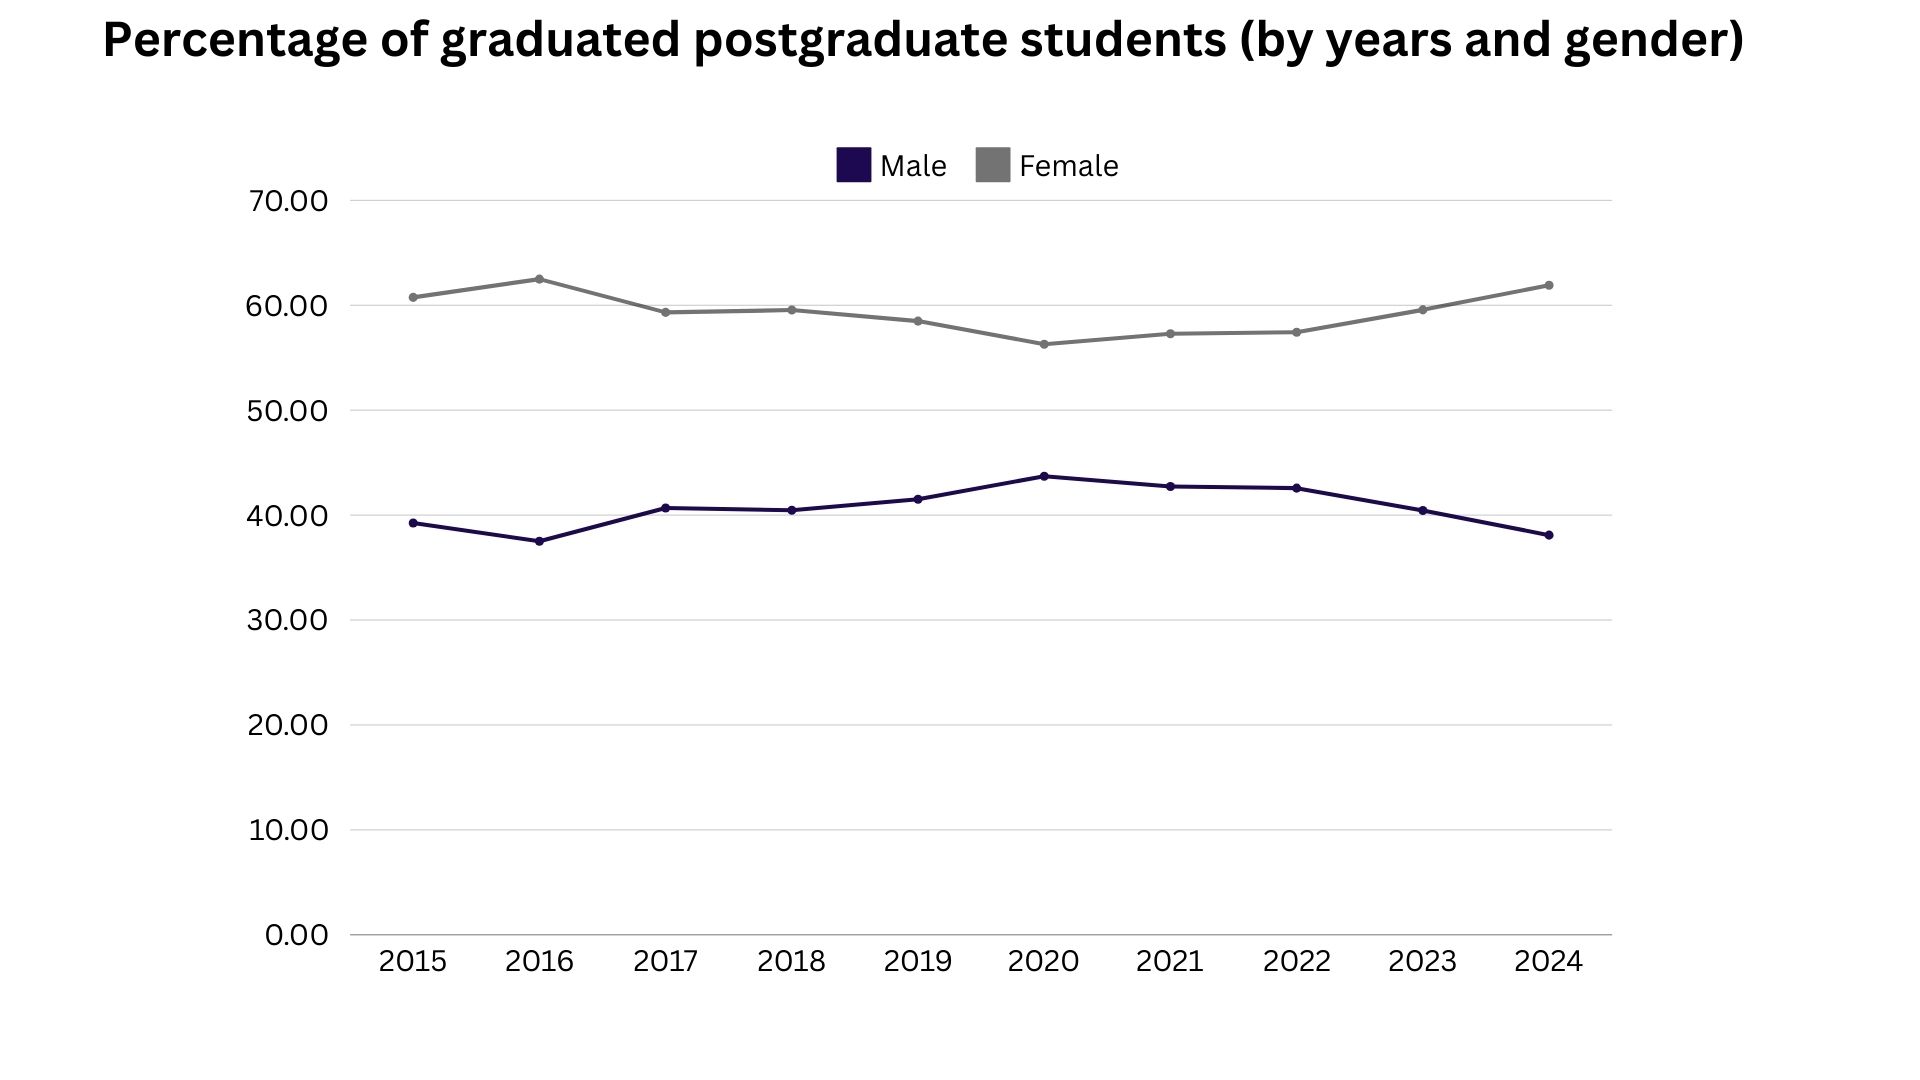
The data from the last ten years highlights a consistent pattern of higher graduation rates among female postgraduate students compared to their male counterparts. Starting from the earliest available data, females maintained a graduation rate of 60.75%, significantly surpassing the 39.25% graduation rate for males. This trend continued across the years, with female graduation rates remaining above 56% in all years, peaking at 62.49% in one of the years.
The smallest difference between female and male graduation rates occurred in the middle of the time frame, where the female graduation rate was 56.29%, while males had a rate of 43.71%, representing the closest the two groups came to parity. However, females still consistently held the advantage.
Towards the end of the period, the graduation rate for females climbed to 61.91%, whereas males saw a decrease to 38.09%, further widening the gap. This trend reinforces the notion that female students are increasingly dominating postgraduate education, both in terms of numbers and success rates.


